
Vaadin does client-side debugging right
One of the caveats when using server-side frameworks is that you often don’t have real debugging possibilities for the client-side generated code. There are often no built-in tools to help the developer with that.
In the XPages world for example the XPages Debug Toolbar (created by Mark Leusink) should be, besides the usual tools like Web Inspector or Firebug, your weapon of choice. As I’m not really into XPages any longer - honestly, never have been really deep into them - I’m not aware if you can find anything better (don’t think so).
As I’m building my web-based applications nowadays nearly solely with the Java-based framework Vaadin (we’re running the same application on Domino, Tomcat or Liberty without changes!) I had to look for something similar for the client-side. That’s where the debug functionality of Vaadin comes into the game. For the sake of completeness: server-side debugging is a no-brainer because it’s a server-side framework that allows the usage of the full Java debug capabilities of Eclipse (or NetBeans or IntelliJ).
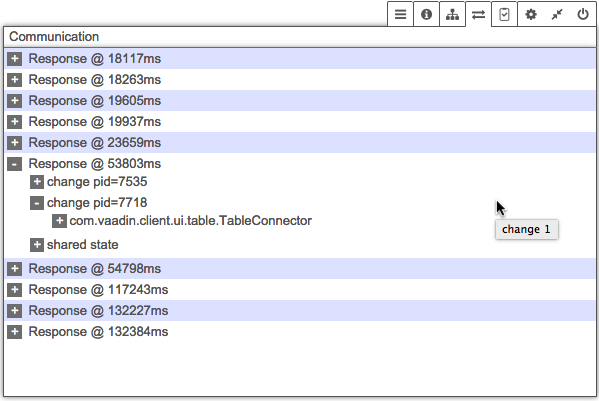
If you create a new Vaadin application the default mode is “production=false”. Which means you can add a simple “?debug” to the application’s URI and you’ll get some amazing built-in functionality available (documented here). The following screenshots show you an excerpt from a live application where layout problems, response/round-trip times and more are shown.
As Vaadin is built on top of the Google Web Toolkit (GWT) you also get the amazing SuperDevMode (described here and here). The SuperDevMode allows you for example to debug JavaScript code in the browser (and Java code in Chrome!).
If you want to try Vaadin I highly recommend to check the Vaadin Boilerplate on Bluemix.